Chapter 4 Missing values
4.1 Missing Values of Global Trends Related Data
Although the BP Global Trends dataset provides a comprehensive report on renewable energy and emission trends at the country level for the past few decades, it has missing data for certain countries. Most notably, the BP dataset doesn’t provide specific country data for African countries. Rather, the BP dataset aggregates these countries into “Western Africa”, “Eastern Africa”, “Southern Africa”, and “Northern Africa”. This is also the case with some small Asian Pacific, Caribbean, European, and Middle Eastern countries. Accordingly, there is no country level data for the small countries located in these regions as well as most of Africa.
The BP’s Statistical Review of World Energy describes Carbon Emissions and 3 types of renewable energy (Hydro, Wind, Solar), across a space-time scale of different countries versus time. Yellow values indicate that the raw values were missing or N/A; purple values indicate otherwise. These values were used within the interactive component for the radius map sections, showcasing how Emissions and the three Renewables change over time as a map.
Interestingly, we note that in all four graphs, the “USSR” tends to have missing values around the mid 1980s onwards; which is likely due to the fact that the “USSR” dissolved around 1990. In the Carbon, Solar and Wind missing data analysis graphs, the countries placed on the top left have missing values; suggesting that some countries were “late” in investing into renewables. Other notable patterns include that for Hydro electric generation, more countries tend to have missing values, particularly the ones from the middle east or island countries such as Singapore. The latter result may suggest that some countries do not have the capacity produce Hydro electric energy as compared to others.
ggplot(carbon_missing_df, aes(x = year, y = fct_reorder(country, -carbon_emissions, sum), fill = Missing)) +
  geom_tile(color = "white") +
  ggtitle("Carbon Emissions: Missing Data Analysis") +
  scale_fill_viridis_d() +
  theme(axis.text.x=element_text(angle=90, hjust=1))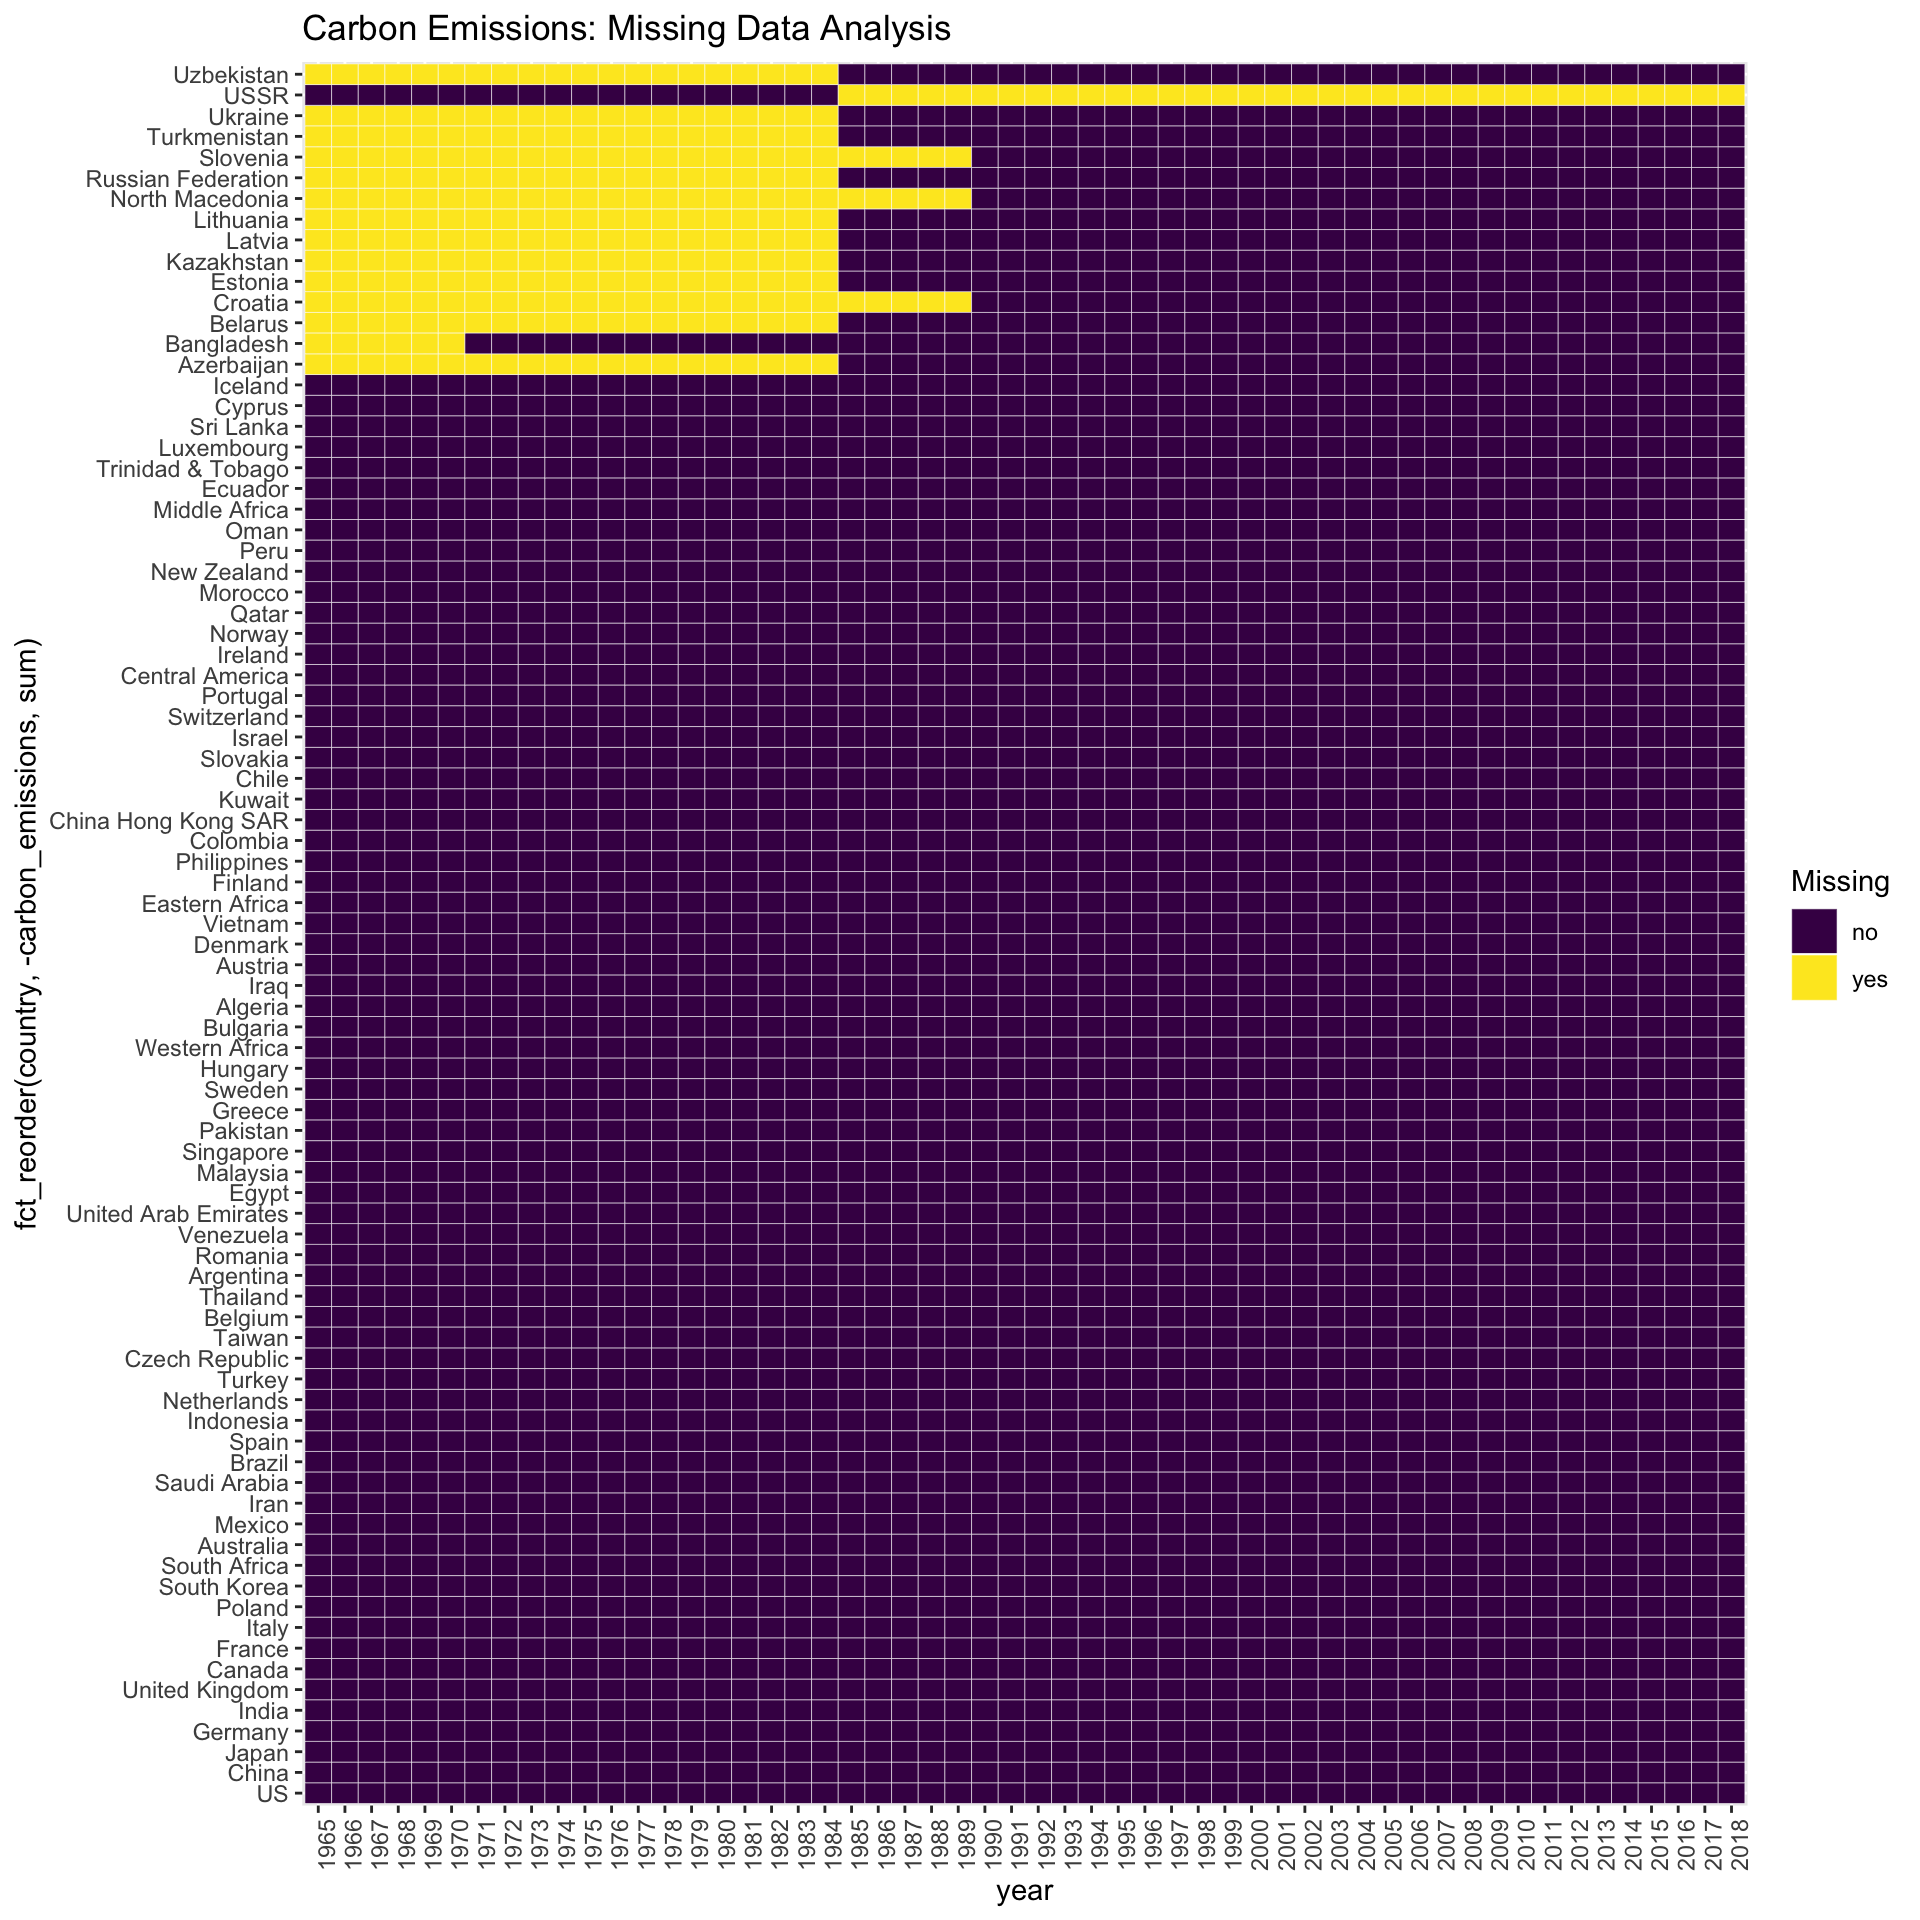
ggplot(hydro_generation_df, aes(x = year, y = fct_reorder(country, -generation, sum), fill = Missing)) +
  geom_tile(color = "white") +
  ggtitle("Hydro generation: Missing Data Analysis") +
  scale_fill_viridis_d() +
  theme(axis.text.x=element_text(angle=90, hjust=1))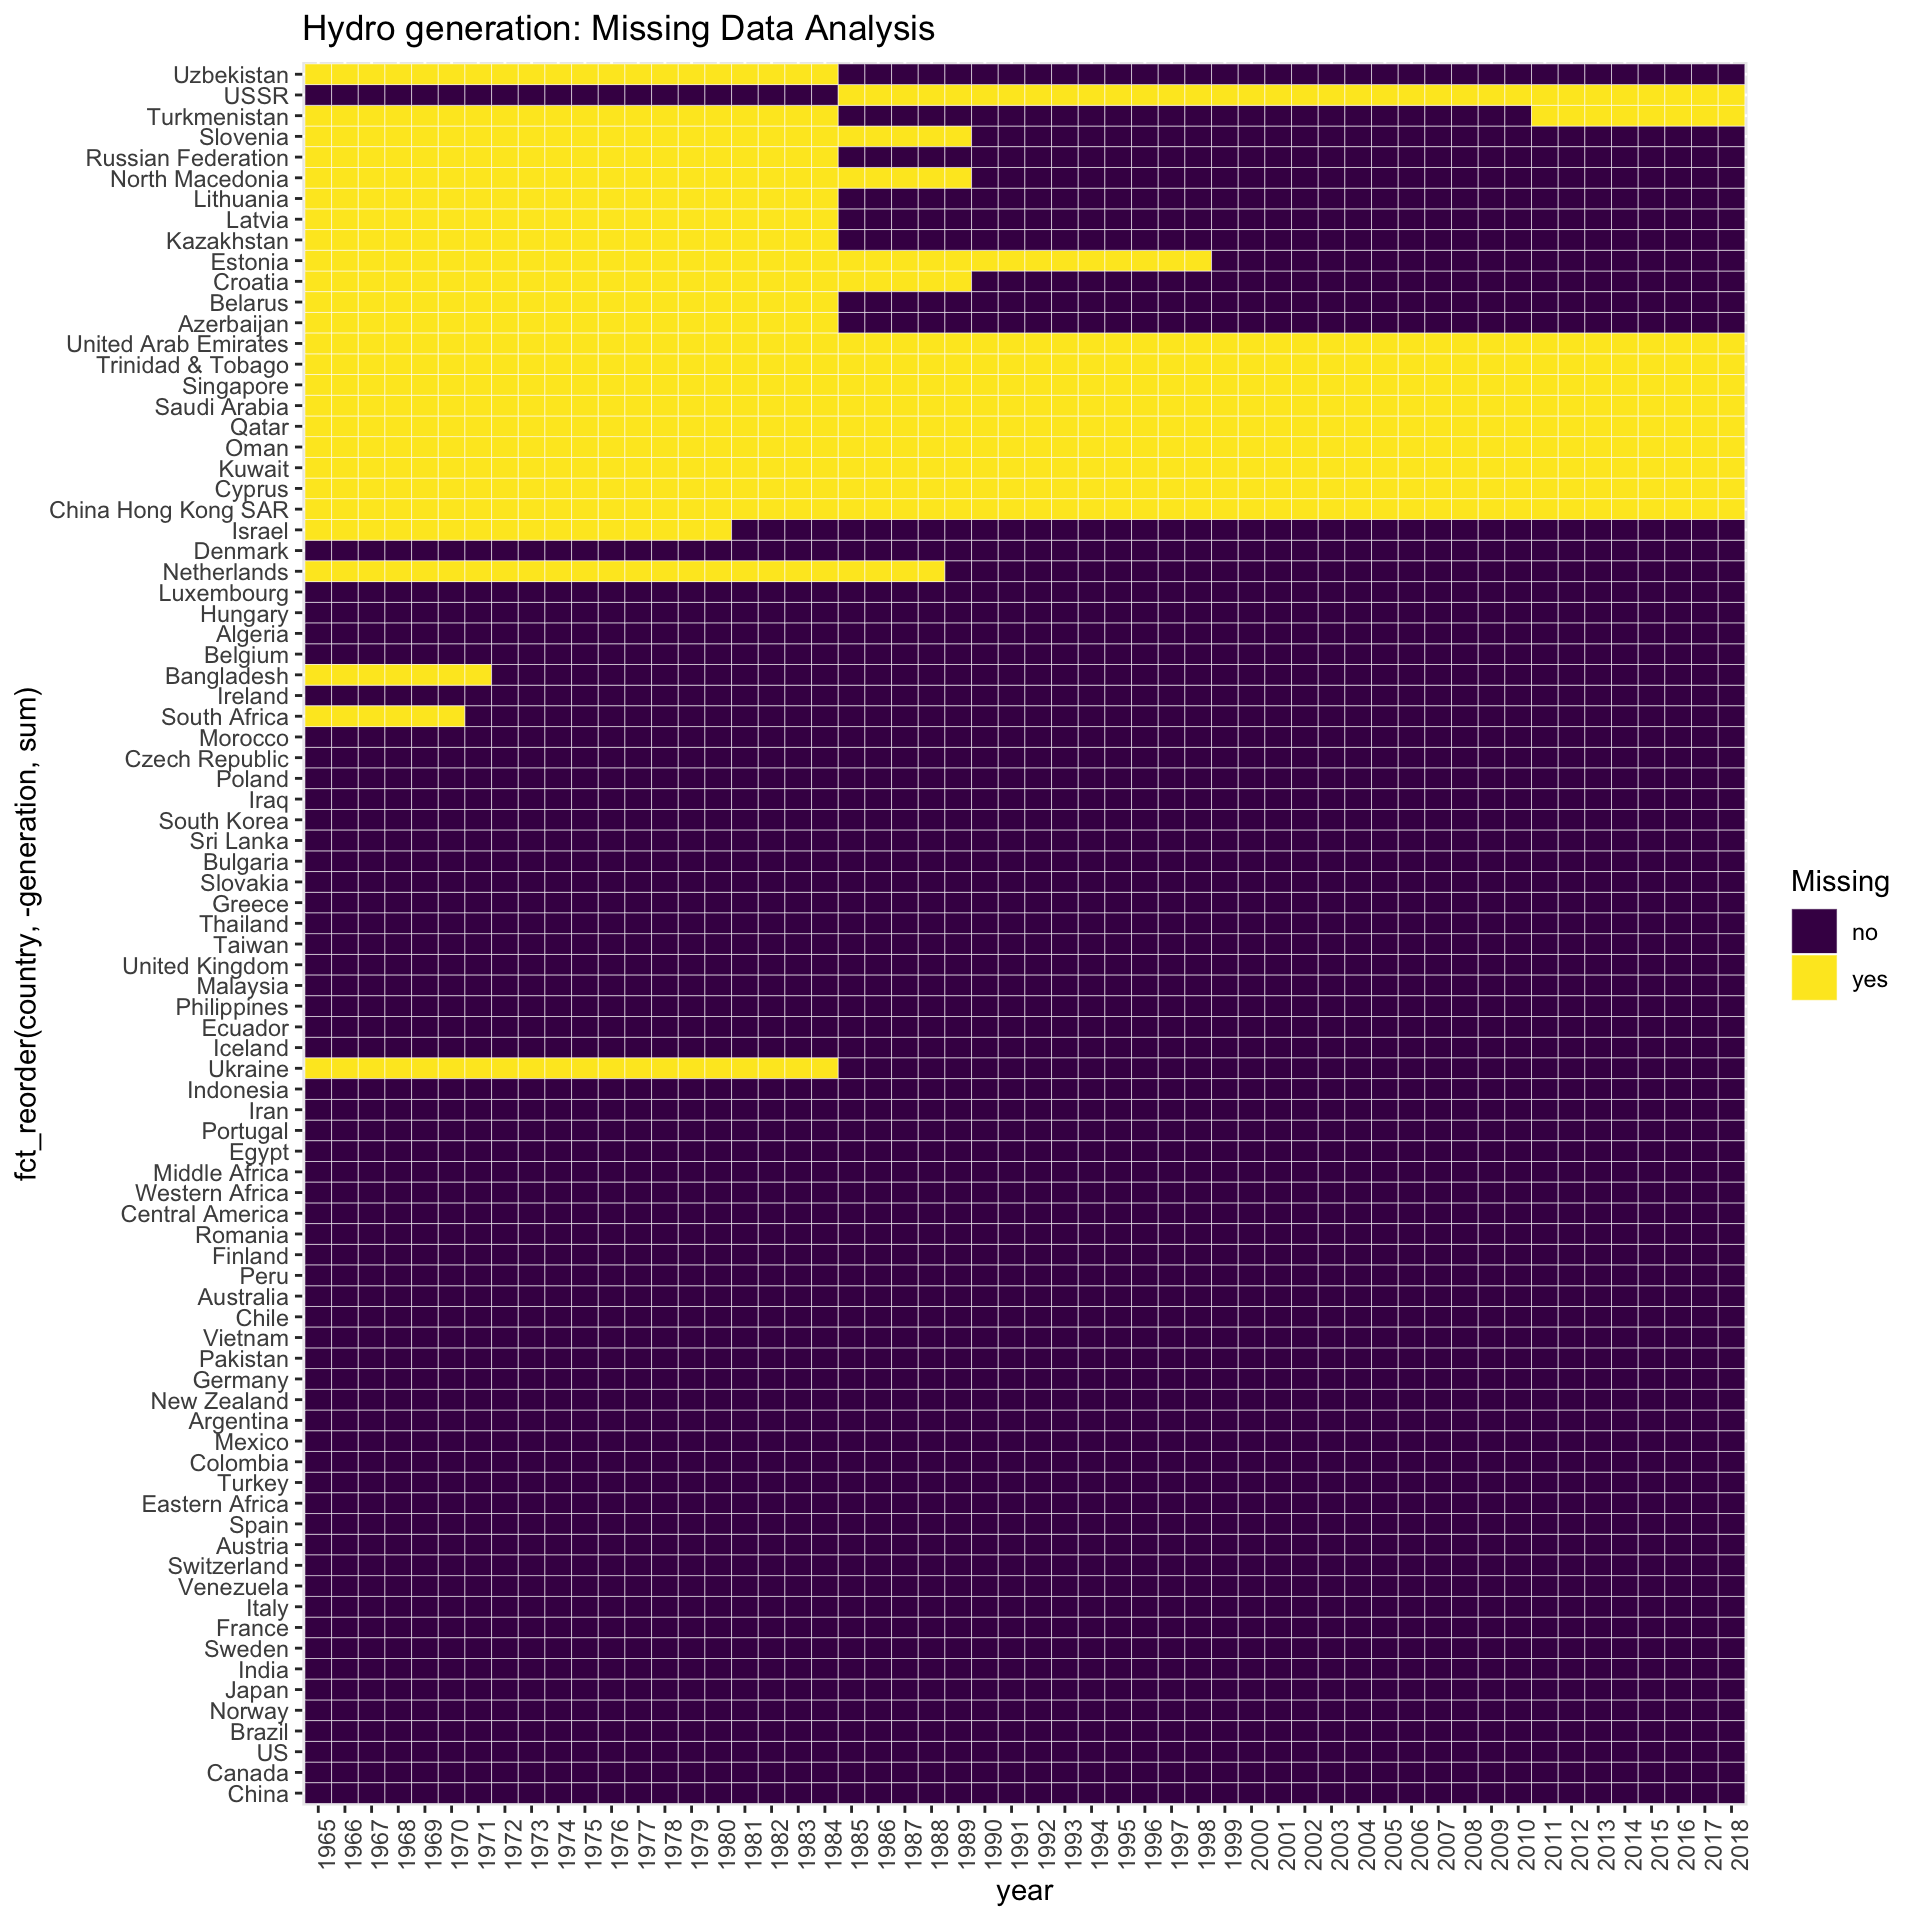
ggplot(wind_generation_df, aes(x = year, y = fct_reorder(country, -generation, sum), fill = Missing)) +
  geom_tile(color = "white") +
  ggtitle("Wind generation: Missing Data Analysis") +
  scale_fill_viridis_d() +
  theme(axis.text.x=element_text(angle=90, hjust=1))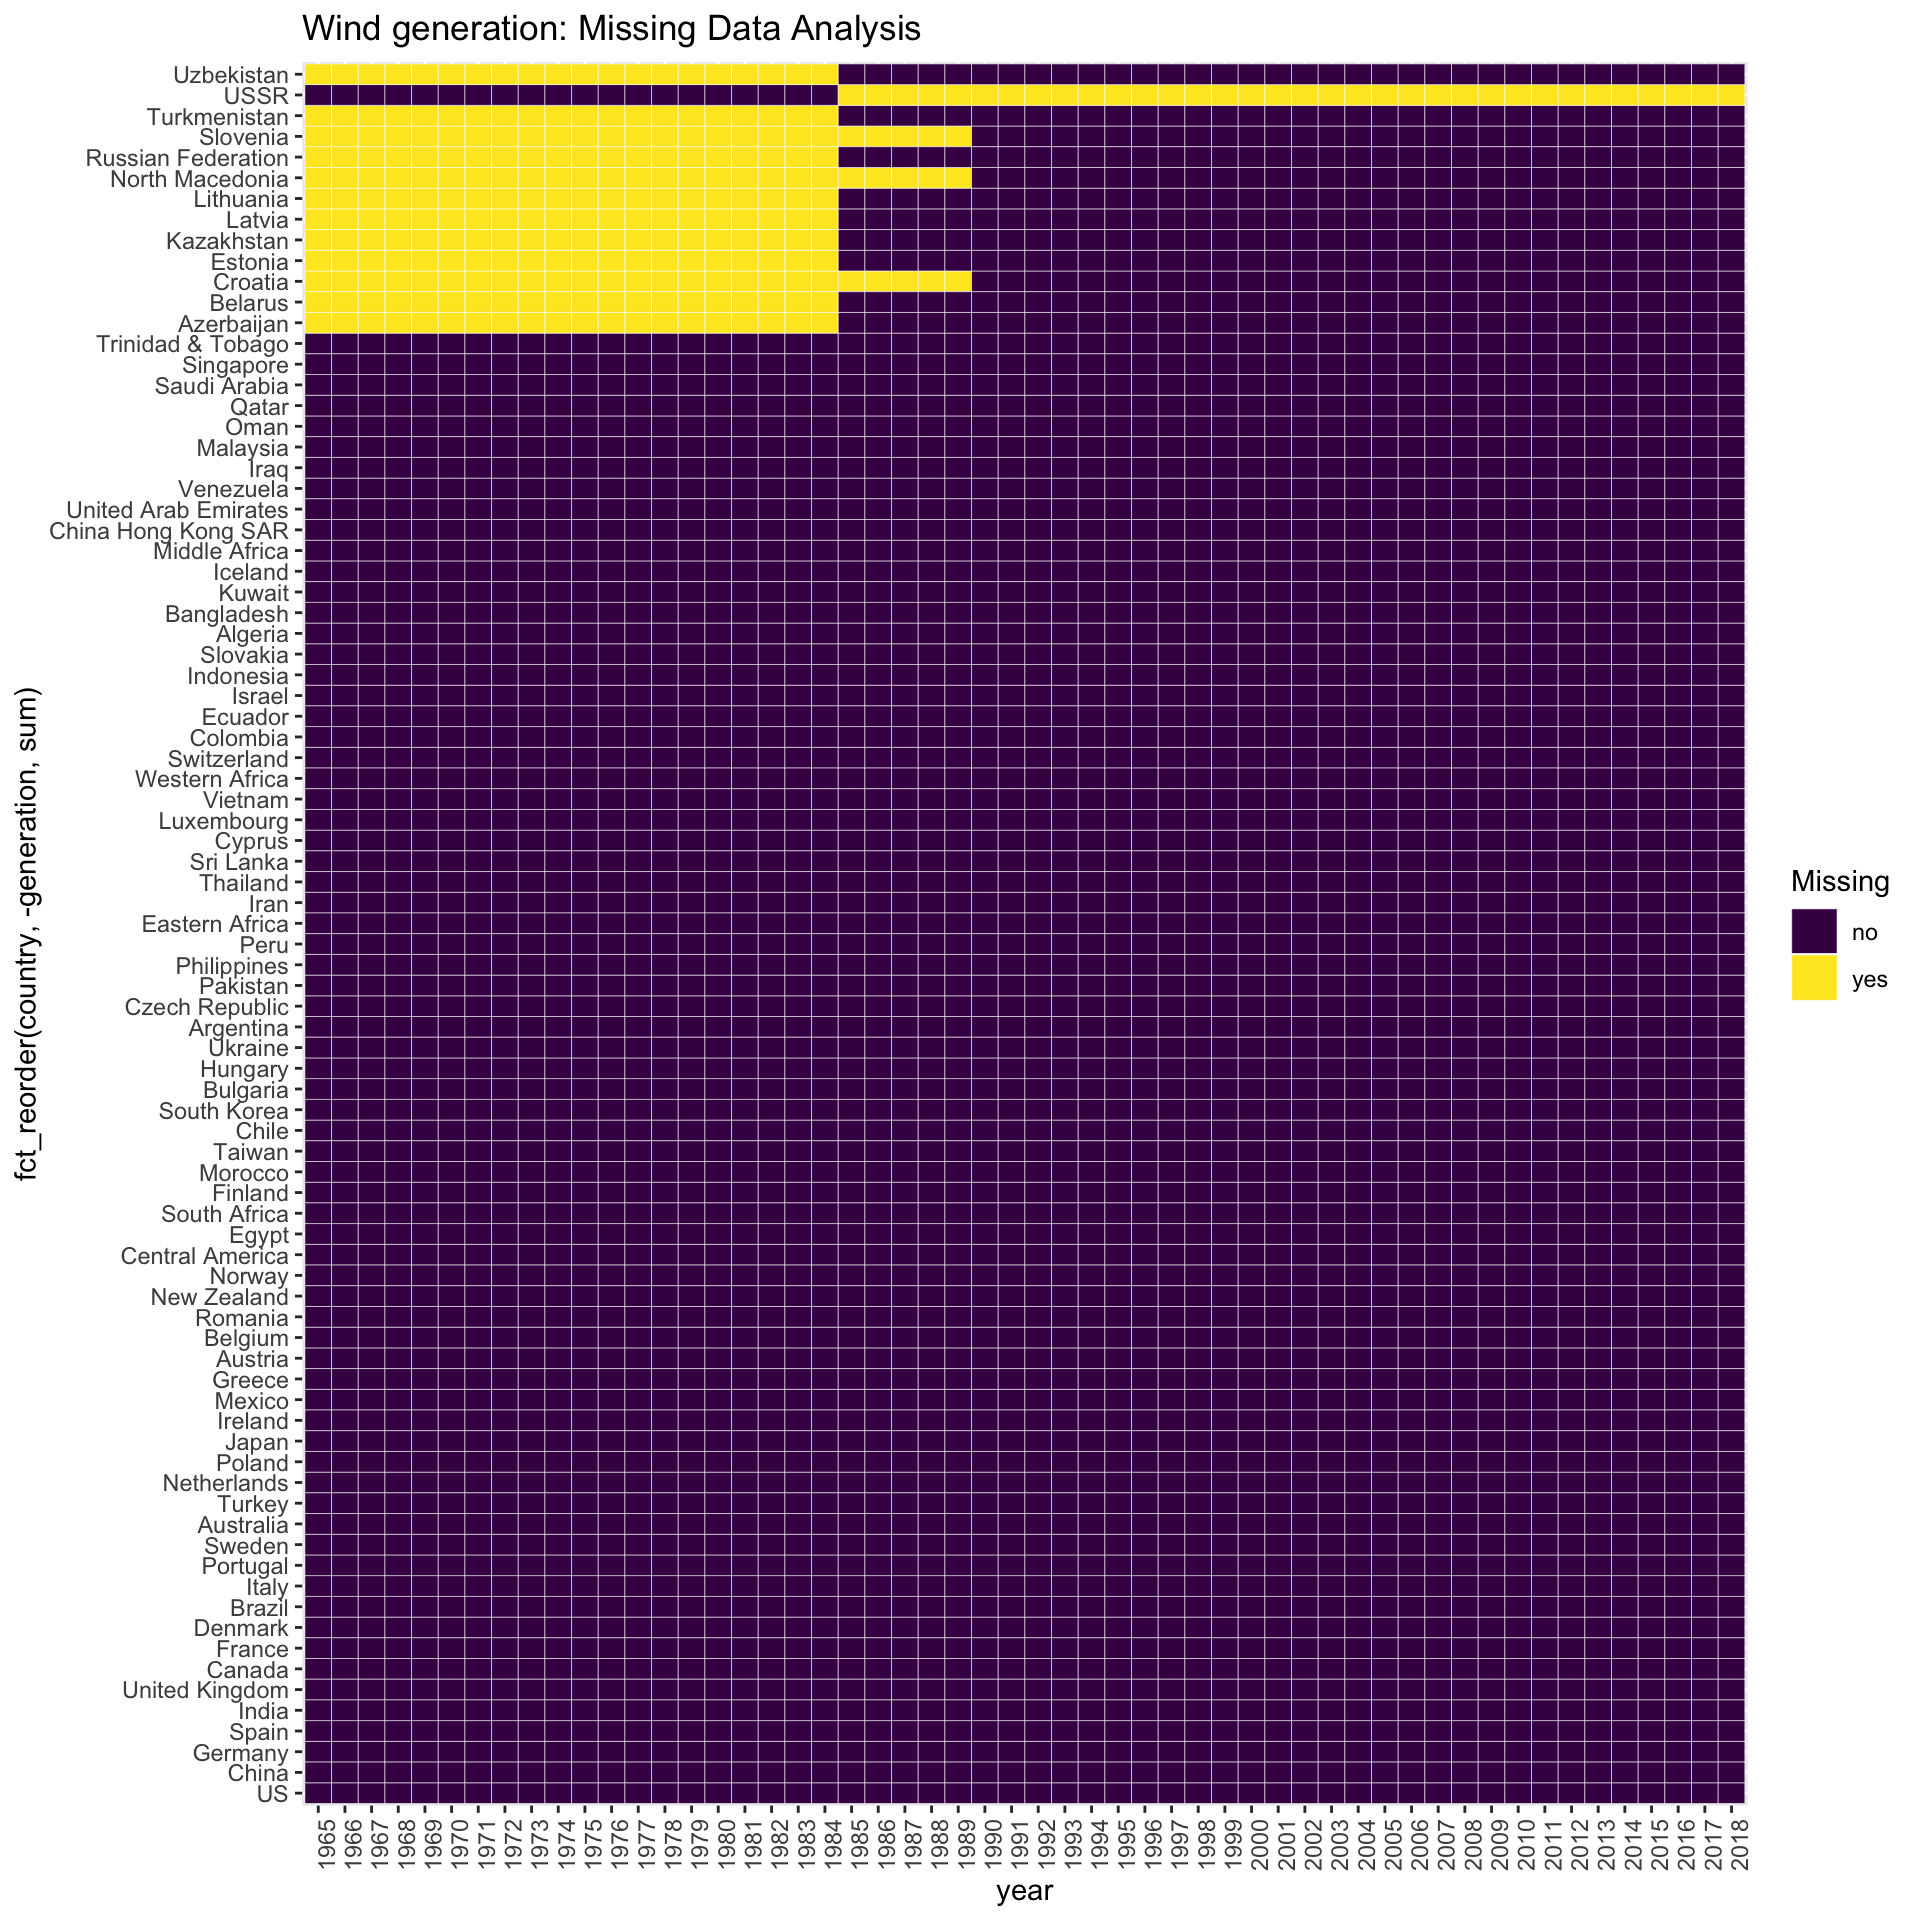
ggplot(solar_generation_df, aes(x = year, y = fct_reorder(country, -generation, sum), fill = Missing)) +
  geom_tile(color = "white") +
  ggtitle("Solar generation: Missing Data Analysis") +
  scale_fill_viridis_d() +
  theme(axis.text.x=element_text(angle=90, hjust=1))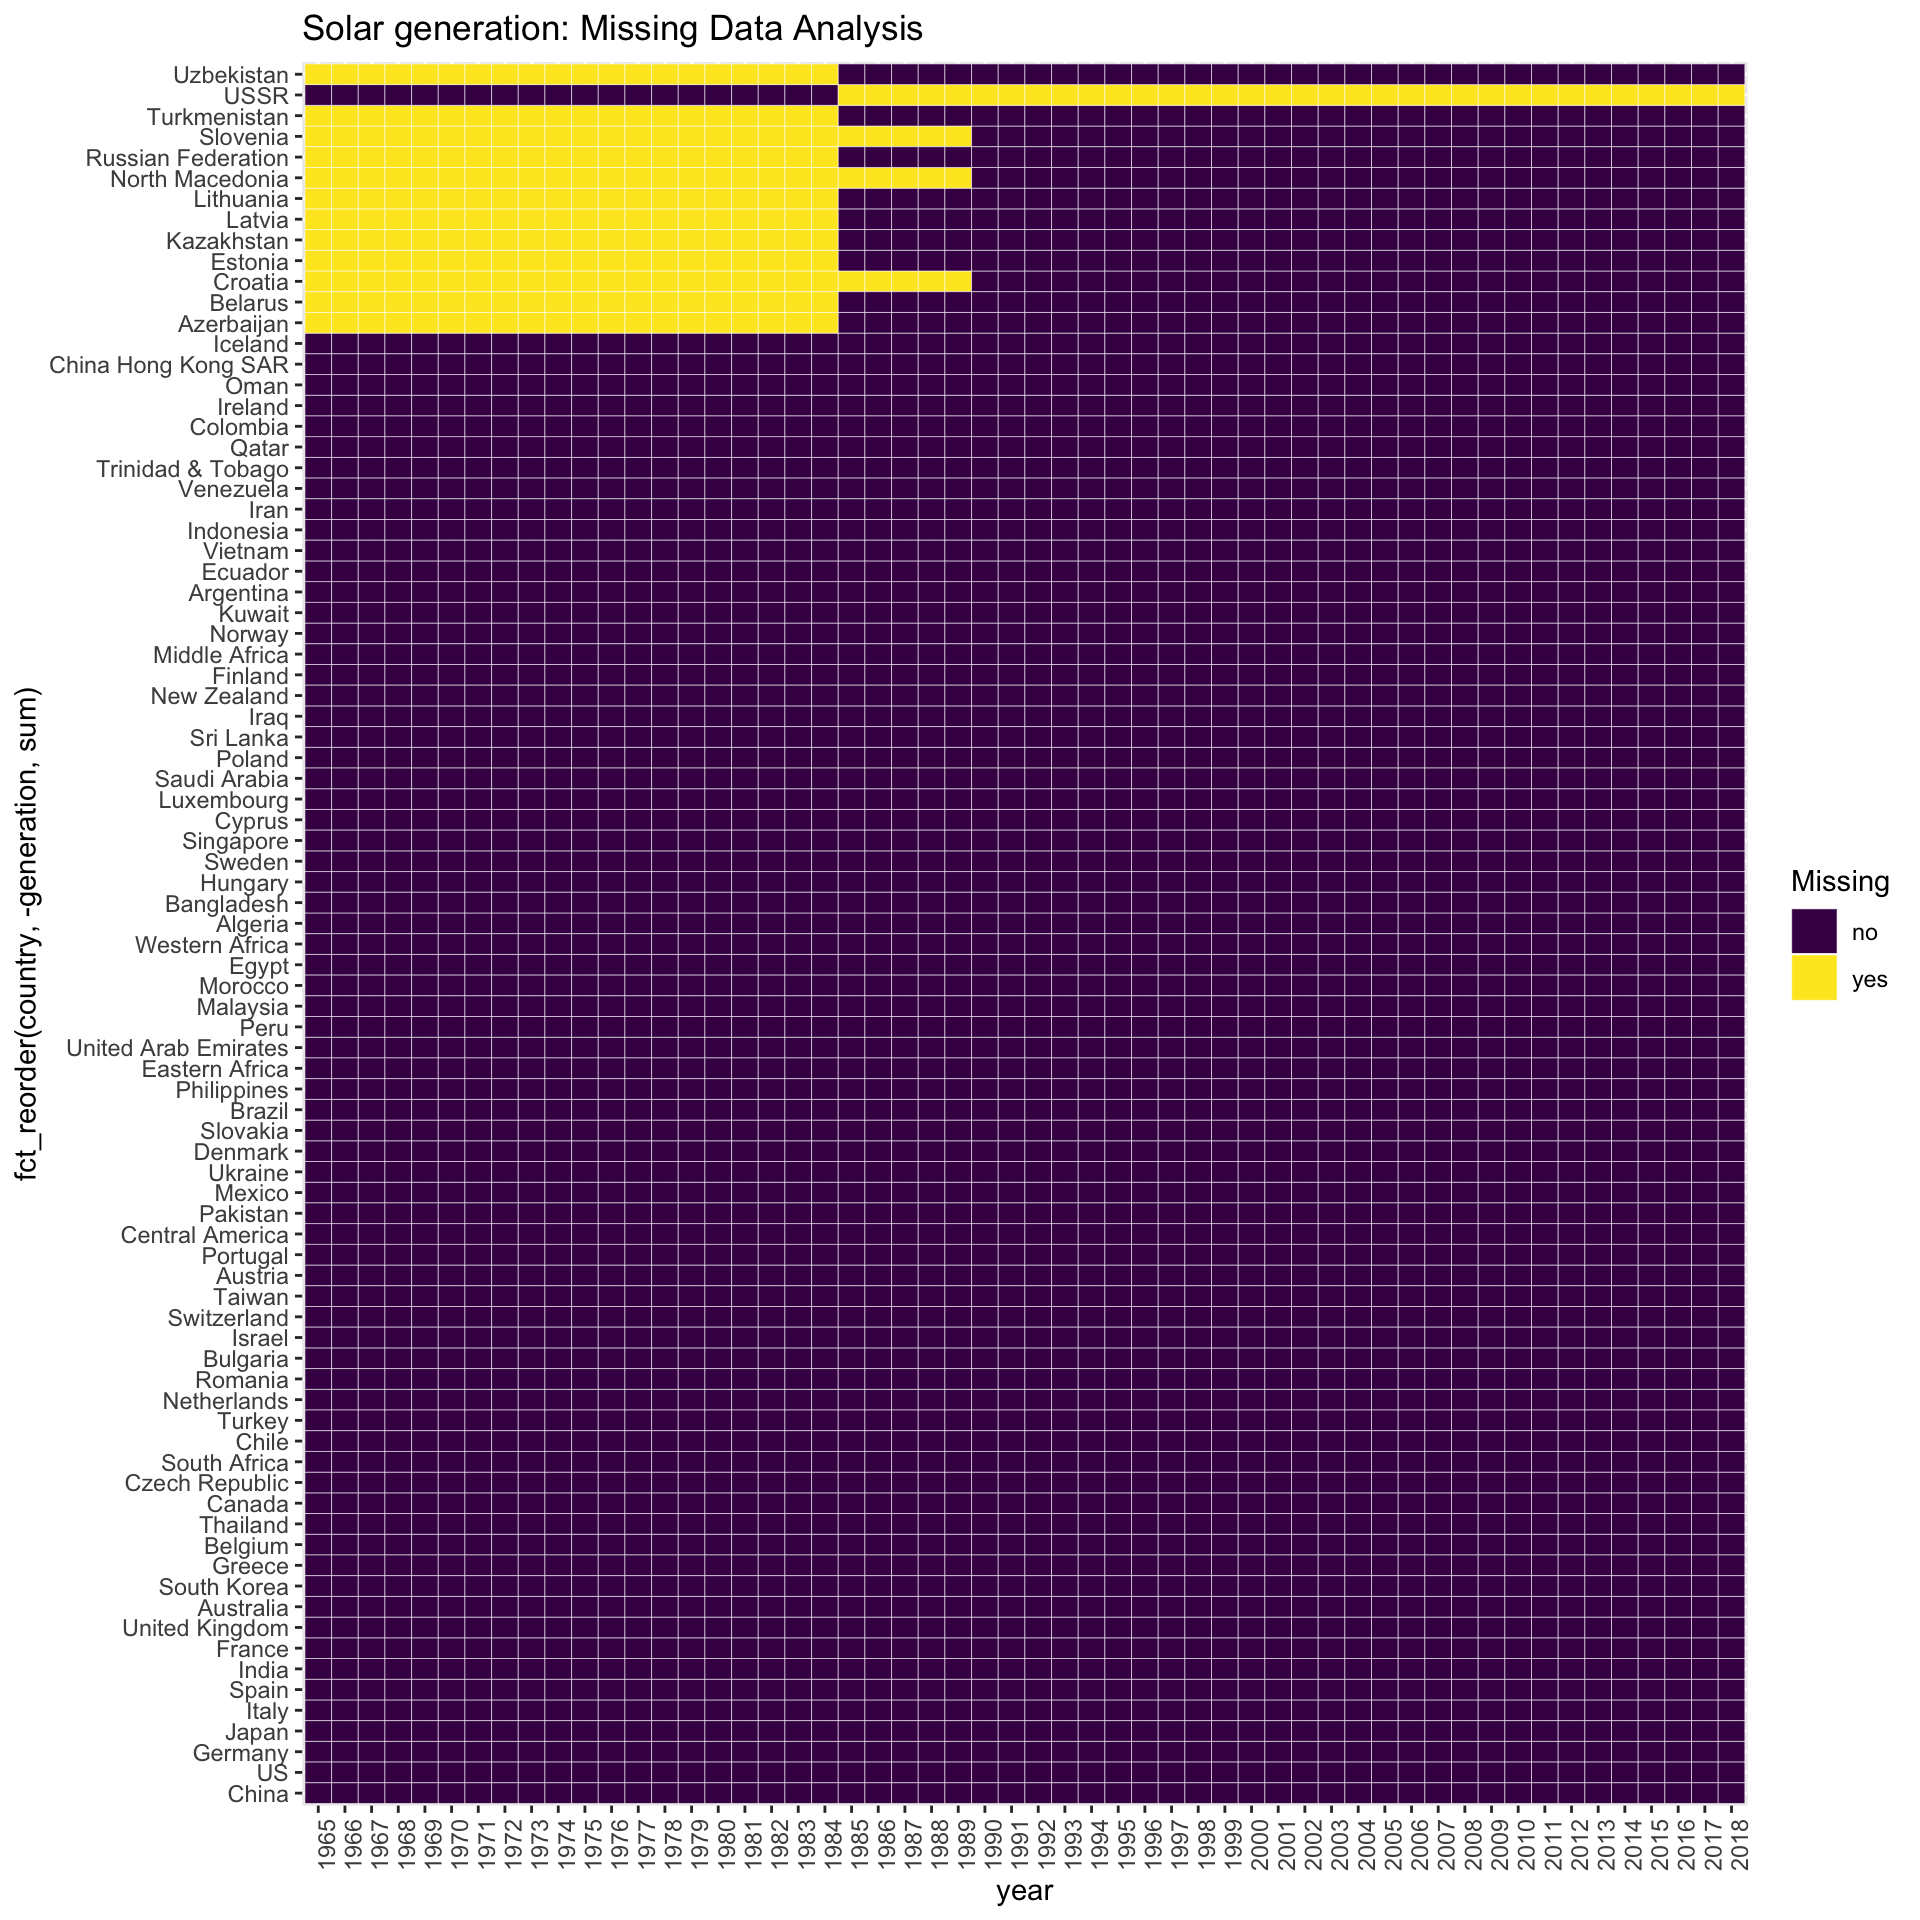
4.2 Missing Values of Finance/Business Related data
In the following data, there were countries that were dropped from the dataset during the data transformation phase. The data were merged using inner join, for simplicity during the analysis, which automatically removed countries that were not included in both datasets. The specific countries that were dropped during the merge are recorded in detail in the data transformation section for reference. In general, less developed countries from Africa, Asia, Europe, and South America were dropped from the data.
4.2.1 Missing Values of invest_to_renewable.csv
##  [1] China          United States  Japan          Germany
##  [5] India          United Kingdom Australia      Spain
##  [9] Netherlands    Sweden         France         South Africa
## [13] Mexico         Vietnam        Denmark        Belgium
## [17] Italy          Morocco        Ukraine        Canada
## [21] Turkey         Norway
## 22 Levels: Australia Belgium Canada China Denmark France Germany ... Vietnam
There are no missing values in this data, but the data only includes 21 relatively developed countries. Therefore, there are many other countries that were not included in this data that need to be considered for a more precise analysis.
4.2.2 Missing Values of renew_gdp_population.csv, num_business.csv, industrial_production_growth_rate.csv
There are also no missing values in these data, but as stated above, there were countries that were dropped during the data transformation phase.
4.2.3 Missing Values of invest_developing_countries.csv
The following graph shows the missing data patterns that appeared in the invest_developing_countries.csv data. Note that the value in each column of the data represents the total investment that was made towards a developing country in million USD of that year.
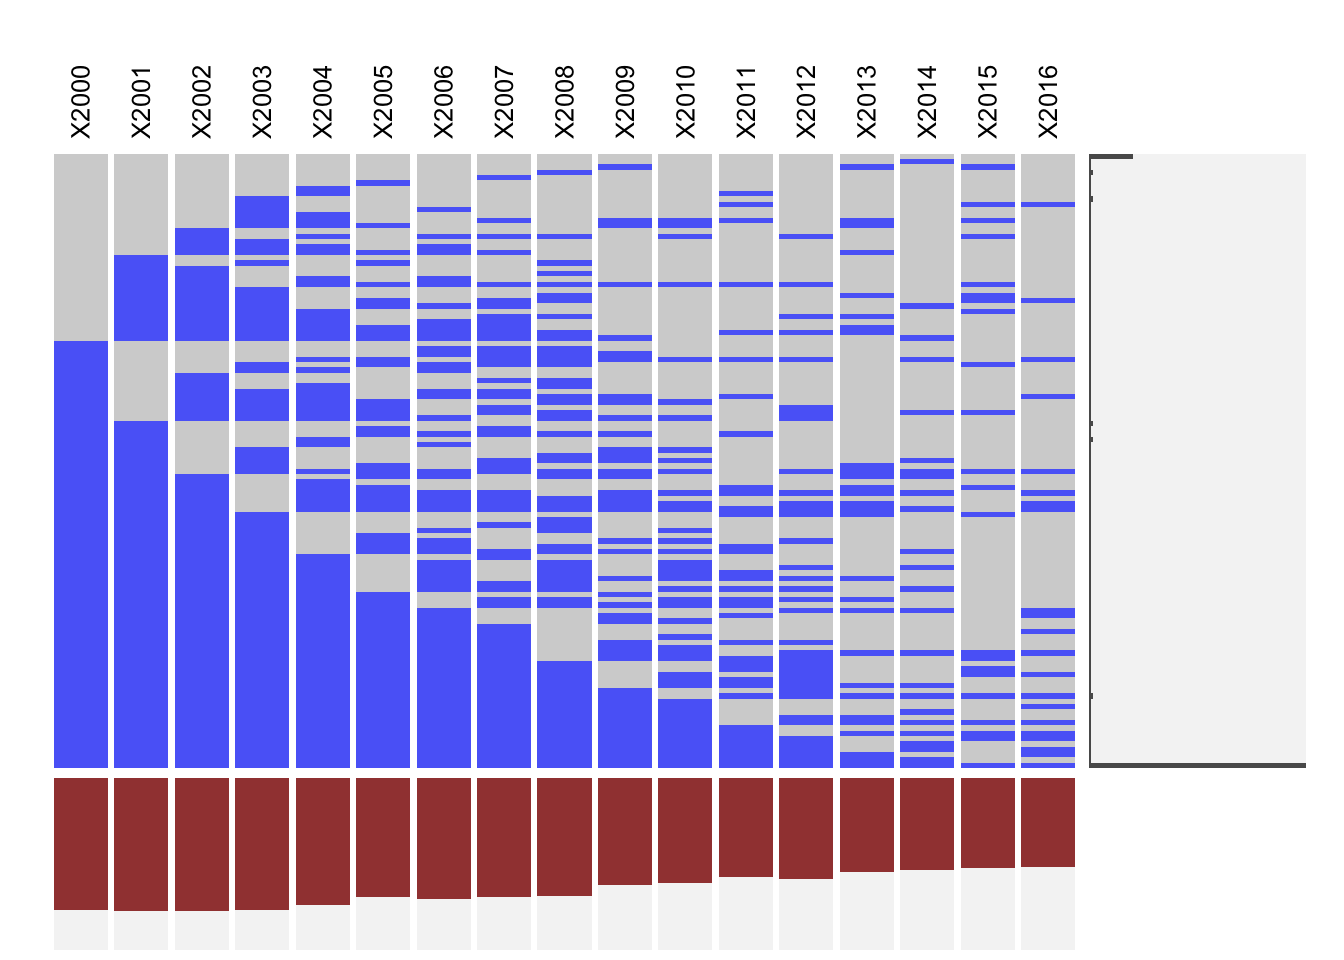
The most frequent missing data pattern was one where all of the values were missing. This may be because there are a few countries that are greatly suited for renewable energy generation, and most countries are not able to gather attention for investments. The next frequent pattern was where the rows in the dataset have no missing values. Regarding the rows that have missing values, there are many different types of patterns of missing data. In general, a gradual decrease in the number of missing values could be seen as the years progress. This means that not all renewable energy related investments started as early as 2000. Additionally, there are patterns where there are no missing values in the beginning, but have missing values in the middle, and have no missing values again at the end. These patterns may be showing countries that had initial investments, but did not have another round of investments until a later year.